To provide the best experiences, we use technologies like cookies to store and/or access device information. Consenting to these technologies will allow us to process data such as browsing behavior or unique IDs on this site. Not consenting or withdrawing consent, may adversely affect certain features and functions.
The technical storage or access is strictly necessary for the legitimate purpose of enabling the use of a specific service explicitly requested by the subscriber or user, or for the sole purpose of carrying out the transmission of a communication over an electronic communications network.
The technical storage or access is necessary for the legitimate purpose of storing preferences that are not requested by the subscriber or user.
The technical storage or access that is used exclusively for statistical purposes.
The technical storage or access that is used exclusively for anonymous statistical purposes. Without a subpoena, voluntary compliance on the part of your Internet Service Provider, or additional records from a third party, information stored or retrieved for this purpose alone cannot usually be used to identify you.
The technical storage or access is required to create user profiles to send advertising, or to track the user on a website or across several websites for similar marketing purposes.
Momentum Analysis: US Retailers – who's buying?
In a difficult year for stocks, Retail has not provided particularly strong performance.While this sub-sector fell along with the general markets in January and early February, it’s recovery has been considerably weaker than the S&P 500. On a YTD basis, XRT (SPDR S&P Retail ETF) has returned about -3.56%. This compares to a 2.28% return delivered by the S&P 500 index.
Smart Momentum analytics, as supplied by Trendrating, detects changes in momentum quickly and reliably, helping investors limit downside capture and protect profits in down markets while presenting positive momentum opportunities not to be missed by the discerning investor.
This report will utilize innovative momentum analytics to assess the health of US Retailers. It will show that even in a lacklustre sub-sector like Retail, the model has been able to spot some clear winners. Analysis like this helps eagle-eyed investors profit from the early identification of developing momentum.
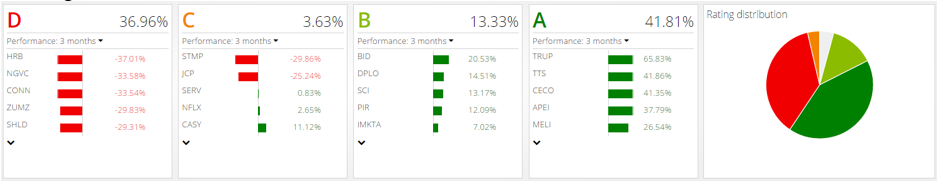
Rating Distribution:
Below is the current distribution of momentum ratings in US Retailers, with a market cap of at least USD 300M, tracked by Trendrating:
As we can see from the diagram, about 55% of this universe is currently trending positively. These positive momentum securities are out performing the benchmark (XRT) over the last three months while the negative momentum securities are mainly underperforming.
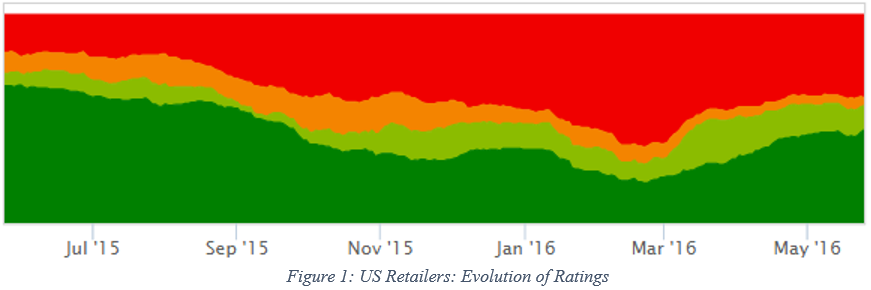
Evolution of Ratings:
The diagram above looks at the evolution of momentum in General Retailers, over the last year. We can clearly see that this sector was moving into negative momentum until about late February where it experienced a mild recovery.
How are Trendrating’s momentum ratings performing in this universe?
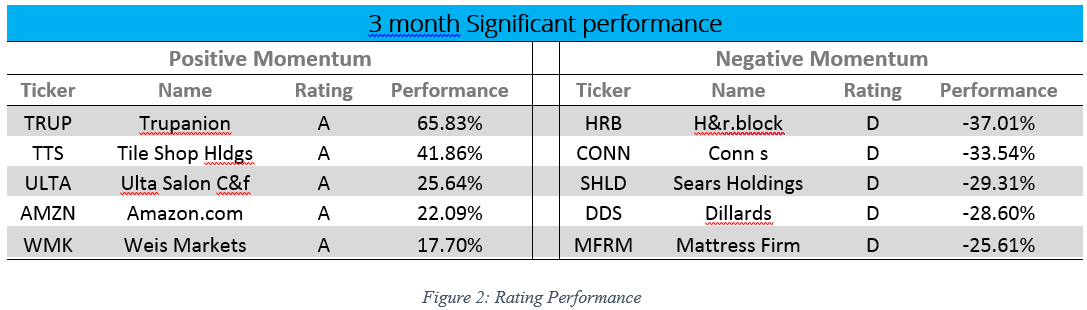
The table below highlights some stocks in positive and negative momentum, with significant performance over the last three months.
From Figure 2 above we can see examples of some A rated securities with spectacular returns over the last three months. We also see the negative performance delivered by some D rated stocks over the same time period.
To conclude, General Retailers have underperformed general markets on a YTD basis. Trendrating’s Smart Momentum Model was quick and accurate enough to identify winners and losers, allowing investors to profit from these trends as they develop.
Charts:
Below are some charts of positively and negatively rated US Retail stocks showing the timing of the most recently identified trend:
Positive Momentum:
Negative Momentum: